Bounce Rate vs Exit Rate vs Engagement Rate in GA4
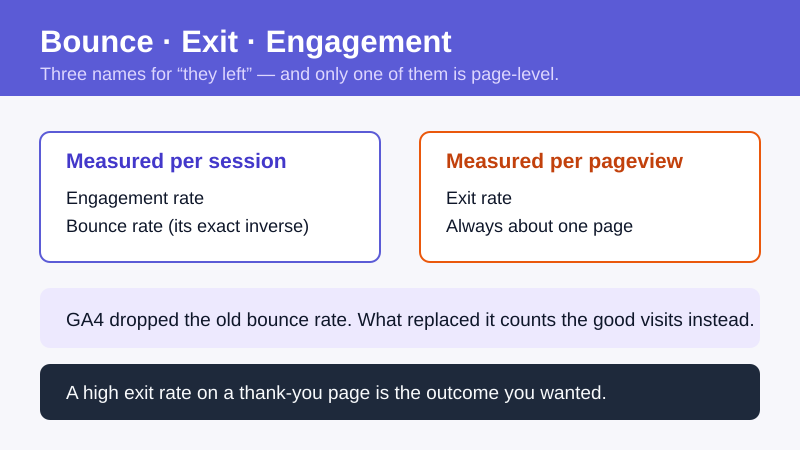
Most teams stare at three metrics — bounce rate, exit rate, and engagement rate — and act on the wrong one. They see a high bounce rate on a blog post and panic, then redesign a page that was doing exactly what it should. The confusion got worse when GA4 quietly redefined what “bounce” even means. The old Universal Analytics number you memorized no longer exists, and the metric that replaced it works backwards from what you’d expect.
This guide draws the lines between all three in GA4 terms. You’ll get a one-screen comparison, the exact criteria for what counts as engagement, a worked example that shows where bounce rate and exit rate diverge, and a decision rule for which metric to trust in which situation. No legacy assumptions — just how these numbers behave in Google Analytics today.
The Three Metrics at a Glance
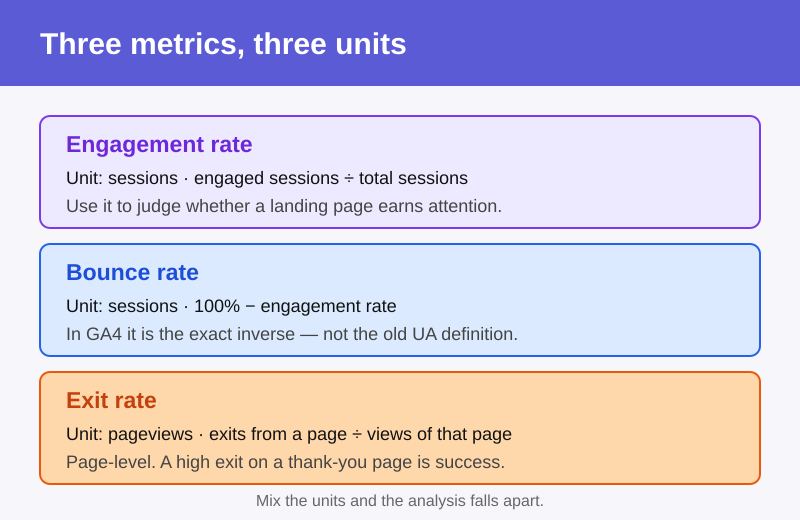
Before the deep dives, here is the whole comparison on one screen. Each metric answers a different question, computes over a different unit, and earns its keep in a different report.
| Metric | What it measures | GA4 formula (plain English) | When to use it |
|---|---|---|---|
| Engagement rate | Share of sessions that were meaningfully active | Engaged sessions ÷ total sessions | Content quality, traffic-source quality |
| Bounce rate | Share of sessions that were not engaged | 1 − engagement rate | Almost never on its own — read engagement rate instead |
| Exit rate | Share of pageviews of a page that were the last in the session | Exits from a page ÷ total pageviews of that page | Funnel leaks, finding the exit page in a flow |
The single most important distinction is the unit. Engagement rate and bounce rate are computed over sessions. Exit rate is computed over pageviews of a specific page. Mix those up and your analysis falls apart, which is exactly what happens on most teams.
What Is Bounce Rate? (and How GA4 Changed It)
In Universal Analytics, a bounce was a single-page session — someone landed, viewed one page, and left without triggering another interaction. Bounce rate was the percentage of sessions that did exactly that. It was crude, but it was simple, and a decade of marketers built mental models on it. That definition is gone.
GA4 redefined bounce rate as the inverse of engagement rate. A session is now a bounce only if it fails every engaged-session test — it was too short, it had no key event, and it had fewer than two pageviews. In other words, bounce rate = 1 − engagement rate. If your engagement rate is 64%, your bounce rate is 36%, by definition. They are two views of the same underlying number.
This flip matters because the two definitions disagree constantly. Under the old rule, a visitor who landed on a long-form guide, read it for four minutes, and left was a bounce — one page, one session, no second click. Under GA4, that same visit is engaged, because it lasted well past the time threshold. A page that looked like it was failing in Universal Analytics can look perfectly healthy in GA4 without a single thing changing on the page.
If a peer article still defines bounce rate as a “single-page visit,” it’s describing a metric Google retired. Read the engagement-rate definition instead — that’s the live number.
What Is Exit Rate?
Exit rate is the metric people most often confuse with bounce rate, and the two are genuinely different. Exit rate is a per-page metric: of all the times a given page was viewed, what percentage were the last page viewed before the session ended? That last page is the exit page.
The key difference from bounce rate is position-independence. A bounce only counts when a page is the entry point of a session that then goes nowhere. An exit can happen anywhere — a visitor might view five pages and leave on the fifth, and that fifth page records an exit even though the session was deeply engaged. Every session ends somewhere, so every session contributes exactly one exit to some page.
That makes exit rate a navigation-flow signal, not a quality verdict. A high exit rate on your order-confirmation page is healthy — people leave after they convert. A high exit rate halfway through a multi-step checkout is a problem worth chasing. Context decides whether the number is good or bad. In GA4 itself, classic “exit rate” lives in the Pages and screens report and exploration views; the metric is “Exits,” and you read it against entrances and views.
What Is Engagement Rate? (GA4’s Headline Metric)
Engagement rate is the metric GA4 puts front and center, and it’s the anchor of this whole trio. It’s the percentage of sessions that were engaged sessions. Where the old bounce rate told you how many visits “failed,” engagement rate tells you, positively, how many visits did something worth counting. Same coin, friendlier face.
Because bounce rate is now defined from engagement rate rather than the other way around, engagement rate is the number you should actually read. It carries all the information; bounce rate is just its mirror image. So the real question becomes precise: what does GA4 count as “engaged”?
What Counts as an Engaged Session
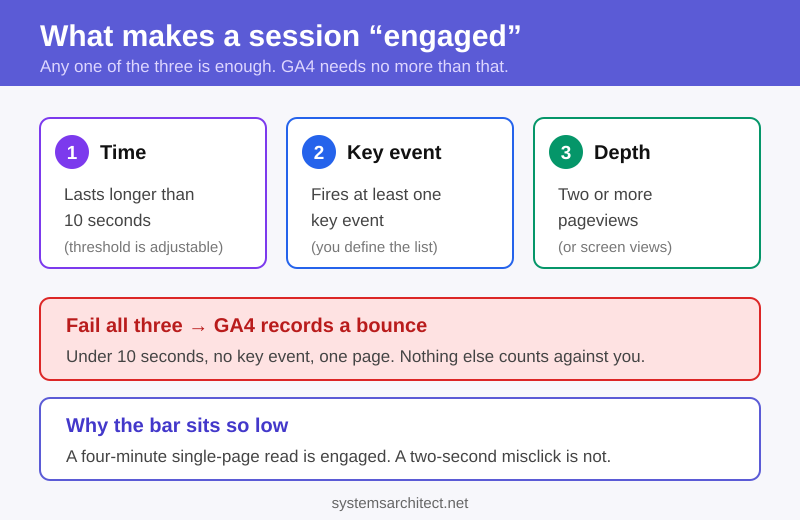
Per Google’s documentation, a session qualifies as an engaged session if it meets at least one of three criteria. Any single one is enough:
- Lasted longer than 10 seconds. This is the engaged-session timer. The 10-second default is configurable per web data stream — you can raise it as high as 60 seconds in your tag settings.
- Included a key event (a conversion). If a tracked key event fires during the session — a form submit, a purchase, a sign-up — the session is engaged regardless of how short it was.
- Had at least 2 pageviews or screenviews. A second page or screen counts as engagement on its own.
Fail all three — under 10 seconds, no key event, and a single-page session — and GA4 records the visit as a bounce. Google’s own reference on engaged sessions spells out the same three conditions, and notes the 10-second threshold is adjustable up to 60 seconds. That’s the precise definition, and it’s why a four-minute single-page read is engaged while a two-second misclick is not. To configure the timer or define which events count as key events, set them up where you configure engaged-session and conversion events in GA4 — the threshold and the conversion list both live in your GA4 admin, not in the report.
Bounce Rate vs Exit Rate — The Key Difference
The cleanest way to separate bounce rate from exit rate is a worked example. Picture four sessions on a small site with three pages: a landing page (L), an article (A), and a pricing page (P).
- Session 1: L → leaves after 3 seconds, no key event. Single-page, under the threshold → bounce. Exit recorded on L.
- Session 2: L → reads for 90 seconds → leaves. Single page, but over 10 seconds → engaged, not a bounce. Exit recorded on L.
- Session 3: A → P → submits the contact form → leaves. Two pages plus a key event → engaged. Exit recorded on P.
- Session 4: A → leaves after 40 seconds. Single page, over the threshold → engaged. Exit recorded on A.
Now compute. For the landing page, two sessions started there and one bounced, so its bounce-related signal is one bounce out of two entrances. But the landing page was also the exit page twice (Sessions 1 and 2), so its exit rate is driven by both of those. Notice that Session 2 is an exit but not a bounce — proof the two metrics measure different things.
For the pricing page, it recorded one exit (Session 3) on a deeply engaged, converting session. A naive reading of “high exit rate = bad page” would flag a page that just produced a conversion. That’s the trap. Exit rate tells you where sessions end; only the surrounding context tells you whether ending there is a problem or a success.
Bounce = a session that started on a page and went nowhere. Exit = a session that ended on a page, no matter how rich it was. One is about entrances; the other is about endings.
Which Metric Should You Use, and When
Here’s the decision rule I apply in practice. It cuts through the confusion faster than any definition:
- Judging content quality or traffic-source quality? Use engagement rate. “Did visits from this campaign do anything meaningful?” is a session-level question, and engagement rate answers it directly. Compare it across channels, landing pages, and audiences.
- Hunting funnel leaks? Use exit rate. Walk a multi-step flow page by page and look for the step where exit rate spikes. That’s where people abandon. This is the metric for checkout, onboarding, and lead forms — anywhere a sequence matters.
- Tempted to report bounce rate on its own? Don’t. Since bounce rate is just 1 − engagement rate, it adds nothing. Report engagement rate instead. The only reason to mention bounce rate is to translate for stakeholders who still think in Universal Analytics terms.
- Diagnosing a page that’s losing traffic over time? Pair engagement rate with trend data. A falling engagement rate on a previously strong page is an early decay signal — worth a look before clicks crater.
In short: engagement rate for quality, exit rate for funnel leaks, and ignore legacy bounce rate unless you imported a Universal Analytics mental model and need to unlearn it. If a page shows weak engagement on otherwise good traffic, treat it as a quality or relevance problem and reduce bounces on your landing pages by tightening message match and load speed.
What Counts as a Good Rate? (Benchmarks)
Everyone wants a target number, so here are honest ranges — with the caveat that “good” depends entirely on page type, intent, and channel. A reference page that answers a question in ten seconds should have lower engagement than an interactive tool.
| Metric | Rough “healthy” range | Read it as |
|---|---|---|
| Engagement rate | ~55–70% for most content sites | Higher is generally better; below ~40% warrants investigation |
| Bounce rate | ~30–45% (the inverse of the above) | Don’t chase it directly — it just mirrors engagement rate |
| Exit rate | No universal “good” number | High is fine on terminal pages, bad mid-funnel |
Two warnings. First, your engaged-session timer skews these numbers: raise it from 10 seconds to 30 and your engagement rate drops, even though visitor behavior never changed. Document the threshold so comparisons stay honest. Second, benchmark against your own history and page type, not a generic industry figure. GA4 offers benchmarking data by category, but a 60% engagement rate means something different for a homepage than for a glossary entry. To turn weak engagement into action, diagnose pages losing engagement at the page level rather than judging the site-wide average.
Frequently Asked Questions
What is the difference between bounce rate and exit rate?
Bounce rate is a session-level metric: the share of sessions that started on a page and never became engaged. Exit rate is a per-page metric: of all views of a page, the share that were the last page in the session. A bounce only counts when a page is the entry point of a dead-end session, while an exit counts whenever a session ends on that page — even after a long, productive visit. So a single page can have a low bounce contribution and a high exit rate at the same time.
Does GA4 still have bounce rate?
Yes, but with a new definition. GA4 redefined bounce rate as the inverse of engagement rate — a session is a bounce only if it fails every engaged-session test. It’s no longer the Universal Analytics “single-page session” number. You can add it to most GA4 reports as a metric, but because it equals 1 − engagement rate, it carries no information that engagement rate doesn’t already give you.
What is a good engagement rate in GA4?
For most content sites, an engagement rate of roughly 55–70% is healthy, and anything below about 40% is worth investigating. The right target depends on page type, intent, and traffic channel — a quick-answer reference page will naturally engage fewer sessions than an interactive tool. Compare against your own historical baseline and the same page type, not a generic industry average. Remember that your engaged-session timer setting directly shifts the number.
How does GA4 calculate engagement rate?
GA4 divides engaged sessions by total sessions. A session counts as engaged if it meets at least one of three criteria: it lasted longer than 10 seconds, it included a key event (a conversion), or it had at least two pageviews or screenviews. The 10-second threshold is the default and is configurable per web data stream, up to 60 seconds. Bounce rate is then simply 1 minus that engagement rate.
Is a high exit rate bad?
Not by itself. Every session ends on some page, so a high exit rate is expected — and healthy — on terminal pages like order confirmations, thank-you pages, and article ends where the user’s task is complete. It only signals a problem when it spikes in the middle of a flow that’s supposed to continue, such as a checkout step or a multi-page form. Always read exit rate against the page’s role in the journey.
When should I look at exit rate instead of bounce rate?
Use exit rate when you’re analyzing a sequence — a checkout, an onboarding flow, a multi-step form — and you need to find the exact step where people drop off. Bounce rate (and its parent, engagement rate) answers a session-level quality question and can’t tell you where in a flow the problem sits. For funnel diagnostics, walk the steps and watch where exit rate jumps; that’s the leak.
Bottom Line
Bounce rate, exit rate, and engagement rate confuse people because they sound similar but measure different things over different units. In GA4, engagement rate is the one that matters: it’s the share of sessions that lasted over 10 seconds, fired a key event, or viewed two or more pages — and bounce rate is just its inverse, so reading both is redundant. Exit rate is a separate, per-page metric that tells you where sessions end, valuable for funnel work but meaningless as a standalone quality verdict.
Apply the rule and you’ll stop misreading these numbers: engagement rate for content and traffic quality, exit rate for funnel leaks, and ignore legacy bounce rate unless you’re translating for someone still thinking in Universal Analytics. When a high exit rate appears, check the page’s role before reacting — and trace where users exit the journey to see whether the ending is a success or a leak.