The Hypothesis Matrix: Structuring Your CRO Program for Exponential Growth
- Ad click → Landing message match
- Product listing → Decision aids/filters
- PDP/Feature page → Proof, comparatives
- Form/checkout → Friction removal, reassurance
- Post-purchase → Activation, referral nudges
The first entry in almost every CRO roadmap—ad click to landing message match—carries the highest leverage. Whether you’re testing a headline or a CTA, the page receiving that click needs to earn the conversion. The landing page optimization guide covers the 12 structural and copy elements that determine whether visitors act.
This prevents over-testing one surface while neglecting true bottlenecks. If you haven’t yet plotted these stages for your own product, start by mapping the customer journey with analytics data so the matrix targets real friction, not assumptions.
3) Business Outcome (What will move?)
Tie to one primary metric aligned with revenue:
- Conversion rate (macro)
- Qualified lead rate / pipeline value
- Revenue per session / AOV
- Activation/retention proxy for subscription or SaaS
Guardrails (refund rate, support tickets, margin) can be noted but shouldn’t replace the primary objective.
4) Evidence Strength (Why do we believe this?)
Score the signal behind the idea:
- 4 – Strong: user research + analytics pattern + prior win
- 3 – Good: research or analytics trend + heuristic rationale
- 2 – Weak: heuristic only or isolated feedback
- 1 – Speculative: inspiration with no data yet
This promotes learning loops instead of roulette testing. Before you trust any test result as evidence, confirm it clears A/B testing statistical significance rather than noise.
5) Impact × Confidence × Effort (ICE)
A small, familiar score to compare opportunities:
- Impact: potential commercial upside if successful
- Confidence: probability the lever truly addresses the cause
- Effort: relative complexity or organizational lift (lower is better)
Normalize to 1–5 (or 1–10) and compute an ICE score to rank.
6) Audience/Segment
Call out who the hypothesis targets: new vs. returning, paid vs. organic, mobile vs. desktop, industry vertical, etc. Many “losers” are winners for the right segment.
7) Learning Objective
What question will this test answer about user behavior? Treat each experiment as a research study, not just a sprint item.
Crafting a High-Fidelity Hypothesis
Use a structured statement to avoid vague ideas:
Because [insight about user psychology or evidence], if we change [specific lever] for [audience] at [journey step], they will [behavioral shift], resulting in [business metric] improving by [direction/expected range], as measured by [metric definition & window].
Example (E-commerce):
Because session replays and surveys show delivery uncertainty stalls checkout, if we add localized delivery-date promises and returns reassurance for first-time mobile visitors on the cart and checkout, they will advance more often, resulting in checkout completion rate increasing by 3–7%, as measured by completed orders / checkout starts over 14 days.
Example (SaaS):
Because interviews reveal prospects can’t map features to their job-to-be-done, if we reframe the hero and feature list into outcome-based modules for mid-market evaluators on the pricing page, they will click “Start trial” more, increasing trial starts per pricing view by 10–15% within 30 days.
Building the Matrix Backlog
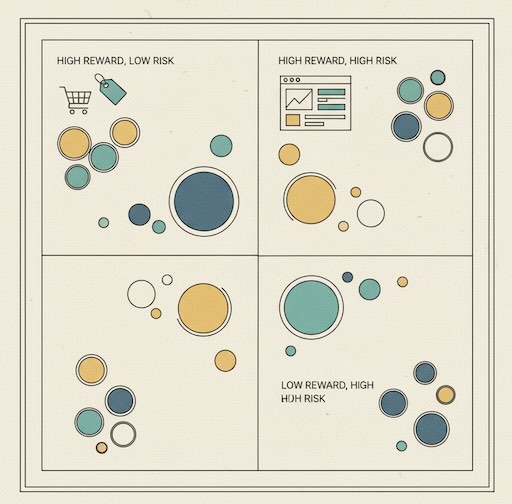
Populate rows with candidate hypotheses and score each dimension. Then sort by a composite rank (e.g., ICE × Evidence Strength, with a small bonus for journey stages currently under-tested). Two practical heuristics:
- Balance Portfolio: each cycle, select 1–2 “sure bets” (high evidence, moderate impact) + 1 “moonshot” (novel psychology, potentially big upside).
- Cover the Funnel: ensure at least one item targets acquisition-message match, one decision proof, and one friction/anxiety near conversion.
Acquisition-message match also depends on traffic hygiene: if paid campaigns lack consistent UTM parameter tagging, segment analysis by source or medium is unreliable, and you can’t accurately attribute test wins to the right channel.
The Psychology-First Playbook (Five Proven Levers)
- Outcome Vividness
Make the “after” state tangible (social proof with quantified timelines, before/after visuals, ROI frames).
Learning prompt: “Do concretes outperform abstracts for this audience?” - Effort Tax Reduction
Shorten steps, remove form fields, auto-fill, or show progress.
Learning prompt: “Is perceived effort the real blocker vs. missing motivation?” - Uncertainty & Risk Reversal
Delivery dates, guarantees, trials, transparent fees.
Learning prompt: “Does de-risking beat discounting here?” - Relevance via Segmentation
Switch from one hero message to intent-matched value propositions (e.g., use case, industry).
Learning prompt: “Which intent cluster yields the highest lift?” - Decision Aids
Comparison tables, best-for badges, expert picks.
Learning prompt: “Do curated defaults reduce choice overload for new users?”
Map each lever to at least one hypothesis per quarter to avoid tunnel vision.
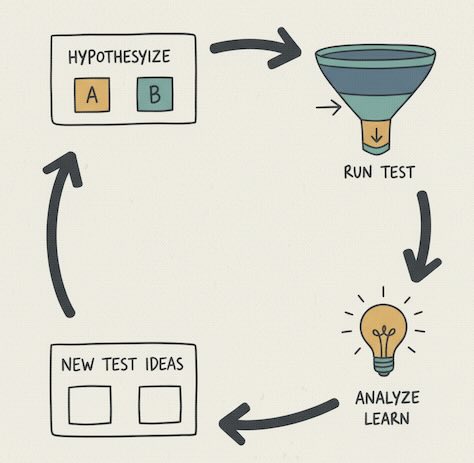
Turning Results into Compounding Insight
A Hypothesis Matrix isn’t a one-way backlog—it’s a knowledge system. For every completed test, log:
- Outcome & effect size (primary metric, guardrails)
- Psychological lever verdict (supported / inconclusive / refuted)
- Segment notes (where it held, where it didn’t)
- Next hypothesis unlocked (what this suggests to try next)
Over time you’ll see “laws” for your audience: e.g., “risk reversal consistently beats discounts for first-time buyers on mobile,” or “outcome framing only lifts when paired with strong proof.”
Avoiding Common Traps
- Tactic drift: “Test the banner” without stating why. Anchor every idea to a psychological lever and learning objective.
- Metric sprawl: chasing secondary metrics muddies decisions. Keep one primary outcome per test.
- Winner’s curse: shipping small wins that contradict long-term value (e.g., boosts orders but tanks margin). Use guardrails.
- Surface bias: over-testing the homepage while checkout leaks revenue. Let journey step analysis guide coverage.
- Segment blindness: declaring a universal “winner” when the lift came from one traffic source. Always cut results by core segments.
Communicating with Stakeholders
Translate matrix outputs into executive-friendly frames:
- Portfolio view: “This cycle covers anxiety at checkout, intent match at acquisition, and effort reduction in signup.”
- Expected value: “Top three hypotheses represent an estimated +$X in monthly revenue if successful.”
- Learning velocity: “We validated 3/5 psychological levers this quarter; next quarter doubles down on the top two.”
Leaders don’t need p-values; they need confidence that the testing program is systematically allocating effort to the highest-value beliefs about customers.
What “Exponential Growth” Really Means Here
There’s no silver bullet. The compounding happens because:
- You test fewer, better ideas (higher base hit-rate).
- Each win reframes the next hypothesis (better directionality).
- You redirect cycles from low-leverage surfaces to genuine bottlenecks (higher ROI per test).
- Insights spread cross-channel (email, paid, in-app), multiplying impact.
That’s how small, steady lifts turn into outsized outcomes.
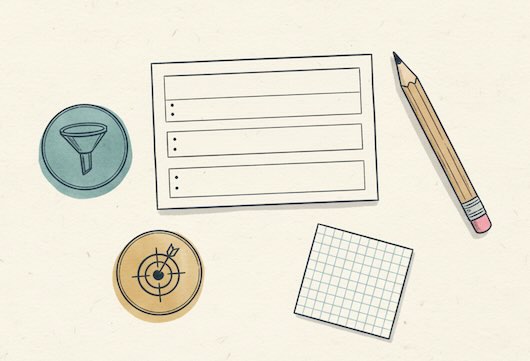
One-Page Template (Copy for your team)
Hypothesis: Because [insight], if we change [lever] for [audience] at [journey step], they will [behavior], increasing [primary metric] by [range], measured by [definition] in [window].
Psych lever: Motivation / Relevance / Clarity / Anxiety / Effort
Evidence strength: 1–4
ICE (I,C,E): _ / _ / _ → Total _
Segment: _
Learning objective: _
Notes / next: _
Bottom line: A Hypothesis Matrix doesn’t add bureaucracy; it removes noise. By grounding every test in user psychology and business value—and by capturing what you learn in a repeatable structure—you transform CRO from a series of stunts into a reliable engine for growth.
If your testing roadmap feels like a grab-bag of ideas (“change the CTA color,” “try a shorter form”), you’re not alone—and you’re leaving growth on the table. High-performing CRO programs don’t chase tactics; they run on a Hypothesis Matrix: a lightweight, structured model that turns scattered guesses into testable, business-aligned hypotheses grounded in user psychology.
Below is a practical, non-technical methodology you can adopt to reshape how ideas are generated, prioritized, and learned from—so each experiment compounds the next.
Why a Hypothesis Matrix?
- Consistency over chaos. Ideas are evaluated against the same criteria, reducing bias and “HiPPO” decisions.
- Psychology first. Tests target the motivations and anxieties that actually move behavior, not just surface UI tweaks.
- Business value upfront. Each hypothesis is tied to a measurable outcome that leadership cares about, not vanity metrics.
- Compounding insights. Results feed back into the matrix, sharpening future bets and accelerating win rates.
The Core Dimensions of the Matrix
Think of the matrix as a grid that scores each hypothesis across a small set of dimensions. Keep it lean—6–8 columns is plenty. Recommended dimensions:
1) Psychological Lever (What belief are we changing?)
Map each idea to the psychological friction it addresses:
- Motivation: clarify the payoff (outcome vividness, value framing, urgency)
- Relevance: match message to intent/segment (job-to-be-done, stage)
- Clarity: reduce cognitive load (information hierarchy, microcopy)
- Anxiety: de-risk the action (social proof, guarantees, expectations)
- Effort: reduce steps or complexity (progressive disclosure, defaults)

Why it matters: hypotheses anchored in a specific psychological lever outperform cosmetic tweaks because they change how decisions are made.
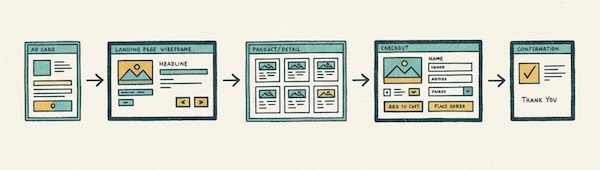
2) Affected Step in the Journey
Where does the leverage live?
- Ad click → Landing message match
- Product listing → Decision aids/filters
- PDP/Feature page → Proof, comparatives
- Form/checkout → Friction removal, reassurance
- Post-purchase → Activation, referral nudges
The first entry in almost every CRO roadmap—ad click to landing message match—carries the highest leverage. Whether you’re testing a headline or a CTA, the page receiving that click needs to earn the conversion. The landing page optimization guide covers the 12 structural and copy elements that determine whether visitors act.
This prevents over-testing one surface while neglecting true bottlenecks. If you haven’t yet plotted these stages for your own product, start by mapping the customer journey with analytics data so the matrix targets real friction, not assumptions.
3) Business Outcome (What will move?)
Tie to one primary metric aligned with revenue:
- Conversion rate (macro)
- Qualified lead rate / pipeline value
- Revenue per session / AOV
- Activation/retention proxy for subscription or SaaS
Guardrails (refund rate, support tickets, margin) can be noted but shouldn’t replace the primary objective.
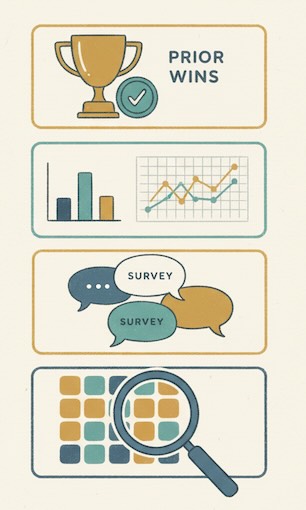
4) Evidence Strength (Why do we believe this?)
Score the signal behind the idea:
- 4 – Strong: user research + analytics pattern + prior win
- 3 – Good: research or analytics trend + heuristic rationale
- 2 – Weak: heuristic only or isolated feedback
- 1 – Speculative: inspiration with no data yet
This promotes learning loops instead of roulette testing. Before you trust any test result as evidence, confirm it clears A/B testing statistical significance rather than noise.
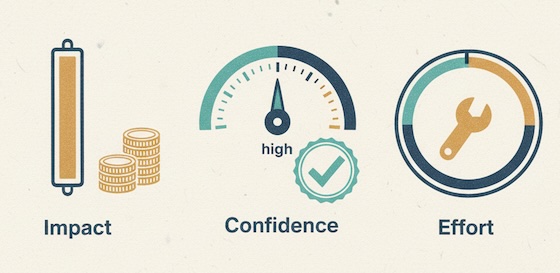
5) Impact × Confidence × Effort (ICE)
A small, familiar score to compare opportunities:
- Impact: potential commercial upside if successful
- Confidence: probability the lever truly addresses the cause
- Effort: relative complexity or organizational lift (lower is better)
Normalize to 1–5 (or 1–10) and compute an ICE score to rank.
6) Audience/Segment
Call out who the hypothesis targets: new vs. returning, paid vs. organic, mobile vs. desktop, industry vertical, etc. Many “losers” are winners for the right segment.
7) Learning Objective
What question will this test answer about user behavior? Treat each experiment as a research study, not just a sprint item.
Crafting a High-Fidelity Hypothesis
Use a structured statement to avoid vague ideas:
Because [insight about user psychology or evidence], if we change [specific lever] for [audience] at [journey step], they will [behavioral shift], resulting in [business metric] improving by [direction/expected range], as measured by [metric definition & window].
Example (E-commerce):
Because session replays and surveys show delivery uncertainty stalls checkout, if we add localized delivery-date promises and returns reassurance for first-time mobile visitors on the cart and checkout, they will advance more often, resulting in checkout completion rate increasing by 3–7%, as measured by completed orders / checkout starts over 14 days.
Example (SaaS):
Because interviews reveal prospects can’t map features to their job-to-be-done, if we reframe the hero and feature list into outcome-based modules for mid-market evaluators on the pricing page, they will click “Start trial” more, increasing trial starts per pricing view by 10–15% within 30 days.
Building the Matrix Backlog
Populate rows with candidate hypotheses and score each dimension. Then sort by a composite rank (e.g., ICE × Evidence Strength, with a small bonus for journey stages currently under-tested). Two practical heuristics:
- Balance Portfolio: each cycle, select 1–2 “sure bets” (high evidence, moderate impact) + 1 “moonshot” (novel psychology, potentially big upside).
- Cover the Funnel: ensure at least one item targets acquisition-message match, one decision proof, and one friction/anxiety near conversion.
Acquisition-message match also depends on traffic hygiene: if paid campaigns lack consistent UTM parameter tagging, segment analysis by source or medium is unreliable, and you can’t accurately attribute test wins to the right channel.
The Psychology-First Playbook (Five Proven Levers)
- Outcome Vividness
Make the “after” state tangible (social proof with quantified timelines, before/after visuals, ROI frames).
Learning prompt: “Do concretes outperform abstracts for this audience?” - Effort Tax Reduction
Shorten steps, remove form fields, auto-fill, or show progress.
Learning prompt: “Is perceived effort the real blocker vs. missing motivation?” - Uncertainty & Risk Reversal
Delivery dates, guarantees, trials, transparent fees.
Learning prompt: “Does de-risking beat discounting here?” - Relevance via Segmentation
Switch from one hero message to intent-matched value propositions (e.g., use case, industry).
Learning prompt: “Which intent cluster yields the highest lift?” - Decision Aids
Comparison tables, best-for badges, expert picks.
Learning prompt: “Do curated defaults reduce choice overload for new users?”
Map each lever to at least one hypothesis per quarter to avoid tunnel vision.
Turning Results into Compounding Insight
A Hypothesis Matrix isn’t a one-way backlog—it’s a knowledge system. For every completed test, log:
- Outcome & effect size (primary metric, guardrails)
- Psychological lever verdict (supported / inconclusive / refuted)
- Segment notes (where it held, where it didn’t)
- Next hypothesis unlocked (what this suggests to try next)
Over time you’ll see “laws” for your audience: e.g., “risk reversal consistently beats discounts for first-time buyers on mobile,” or “outcome framing only lifts when paired with strong proof.”
Avoiding Common Traps
- Tactic drift: “Test the banner” without stating why. Anchor every idea to a psychological lever and learning objective.
- Metric sprawl: chasing secondary metrics muddies decisions. Keep one primary outcome per test.
- Winner’s curse: shipping small wins that contradict long-term value (e.g., boosts orders but tanks margin). Use guardrails.
- Surface bias: over-testing the homepage while checkout leaks revenue. Let journey step analysis guide coverage.
- Segment blindness: declaring a universal “winner” when the lift came from one traffic source. Always cut results by core segments.
Communicating with Stakeholders
Translate matrix outputs into executive-friendly frames:
- Portfolio view: “This cycle covers anxiety at checkout, intent match at acquisition, and effort reduction in signup.”
- Expected value: “Top three hypotheses represent an estimated +$X in monthly revenue if successful.”
- Learning velocity: “We validated 3/5 psychological levers this quarter; next quarter doubles down on the top two.”
Leaders don’t need p-values; they need confidence that the testing program is systematically allocating effort to the highest-value beliefs about customers.
What “Exponential Growth” Really Means Here
There’s no silver bullet. The compounding happens because:
- You test fewer, better ideas (higher base hit-rate).
- Each win reframes the next hypothesis (better directionality).
- You redirect cycles from low-leverage surfaces to genuine bottlenecks (higher ROI per test).
- Insights spread cross-channel (email, paid, in-app), multiplying impact.
That’s how small, steady lifts turn into outsized outcomes.
One-Page Template (Copy for your team)
Hypothesis: Because [insight], if we change [lever] for [audience] at [journey step], they will [behavior], increasing [primary metric] by [range], measured by [definition] in [window].
Psych lever: Motivation / Relevance / Clarity / Anxiety / Effort
Evidence strength: 1–4
ICE (I,C,E): _ / _ / _ → Total _
Segment: _
Learning objective: _
Notes / next: _
Bottom line: A Hypothesis Matrix doesn’t add bureaucracy; it removes noise. By grounding every test in user psychology and business value—and by capturing what you learn in a repeatable structure—you transform CRO from a series of stunts into a reliable engine for growth.