Landing Page Optimization: 12 Elements That Drive Conversions

Landing page optimization showing conversion rate benchmarks from 2.35% average to 11.45% top performers

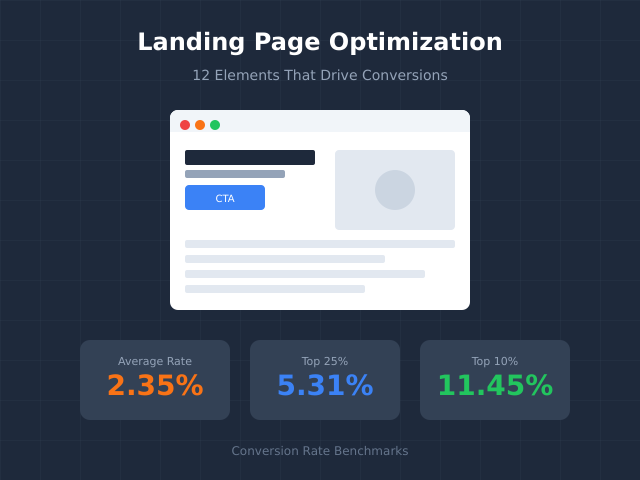
The average landing page converts at 2.35%. The top 10% convert at 11.45% or higher. That’s a 5x difference—and it comes down to getting the fundamentals right. This guide covers the 12 elements that separate high-converting landing pages from the ones that leak money. Why Most Landing Pages Underperform Landing pages fail for predictable reasons. … Read more

A/B Testing Statistical Significance: Sample Size Calculator Guide

A/B testing statistical significance comparison showing variant A vs B with confidence metrics

Running an A/B test without understanding statistical significance is like flipping a coin and calling it strategy. You might get lucky, but you’re not making data-driven decisions. This guide breaks down the math behind valid A/B tests—and gives you the formulas to calculate sample size before you start. What You’ll Learn What statistical significance actually … Read more

What Content Works Best in Your Niche: A Data-Driven Approach

Illustration of content strategy: formats → metrics and business outcomes

You don’t need a giant martech stack to learn what resonates. With a few simple signals, you can see which topics, formats, and angles actually earn attention in your niche—and steer your roadmap accordingly. Think of this as a decision guide, not a tooling tutorial. First, what “data-driven” really means If your team ever asks … Read more