
You don’t need a data science team to figure out which posts are pulling in the crowds. You need a clear definition of “popular,” a consistent way to compare posts that launched at different times, and a short list of signals that reveal not just raw traffic—but durable reach you can build on.
Below is a practical, implementation-light playbook you can use with whatever analytics you already have.
First, define “popular” the smart way
“Most visitors” can mean different things depending on your goals. Pick the lens that fits your situation:
- Peak reach: Which post brought the largest audience in a short window? (Great for campaigns and launches.)
- Sustained reach: Which post keeps bringing visitors month after month? (Best for SEO and evergreen content.)
- Qualified reach: Which post pulls visitors who keep exploring? (Important for audience growth and brand affinity.)
You can (and should) look at all three—but decide which one is your primary scoreboard before you compare posts.
Core signals that actually answer the question
Think of these as the “vital signs” of content reach. They’re tool-agnostic and easy to interpret.
1) Entrances (or landing sessions)
How many sessions start on the post? This strips out navigation traffic and tells you which piece is acting as a front door. If your goal is new audience, entrances beat raw pageviews as a popularity signal.

Use it to answer: Which single post is the most common first touch?
2) Unique visitors (or users) by post
Counts people, not clicks. A post with fewer pageviews but more unique visitors might be better at attracting fresh eyes than a post binge-read by a smaller group.

Use it to answer: Which post expands our reach to more individuals?
3) New vs. returning visitors by post
High new share suggests discovery power; balanced new/returning suggests a fan-favorite that keeps regulars engaged.

Use it to answer: Is this post widening the audience or deepening loyalty?
4) Traffic source mix per post
Break down entrances by source/medium (search, social, referral, direct, email). A post that wins across multiple sources is less fragile than one propped up by a single viral spike.

Use it to answer: Is this popularity repeatable or dependent on one channel?
5) Impressions and CTR (for search-led posts)
If you can see search impressions, pair them with click-through rate. A high-impression, low-CTR post is a sleeping giant: the topic is in demand, the snippet needs work.

Use it to answer: Is the topic hot, and are we capturing the click?
Normalize for time so the comparison is fair
Older posts have had more time to accumulate traffic. Avoid “seniority bias” by comparing on like-for-like windows:
- Day-7 and Day-30 totals after publish (or after promotion start)
- Month-over-month trend for the last three months
- Decay curve: traffic from week 1 → 4 → 12 (steep drop vs. slow taper)
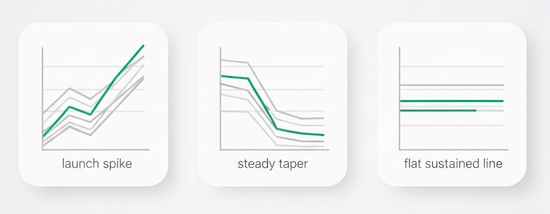
A post with a modest Day-1 but a flat decay line is often the true winner, because it compounds.
Go from posts to themes (where strategy lives)
Individual articles are noisy; topics reveal patterns. Tag or group posts into 5–10 themes (e.g., “Beginner Guides,” “Tool Comparisons,” “Industry News,” “Case Studies”). For each theme, aggregate the same signals:
- Theme entrances (30/90 days)
- Theme search impressions & CTR
- Theme new-visitor share
- Theme average pages per session (are readers exploring the cluster?)
This shows not just which post pops, but which topic areas your audience repeatedly proves they want. That’s your editorial roadmap.
A simple popularity score you can compute
No fancy models—just a weighted composite to rank posts side by side. Example weights for a 30-day window:
- Entrances (40%) – normalize per 1,000 sessions sitewide
- Unique visitors (25%) – normalize per 1,000 users sitewide
- New-visitor share (15%) – higher is better if growth is the goal
- Multi-channel strength (10%) – number of sources contributing ≥10%
- Search CTR vs. peer average (10%) – lift or drag relative to similar rankings
Score each post 0–100 on the factors you have; average with the weights above. Re-rank monthly. You’ll get a stable, defensible “most visitors” leaderboard that isn’t fooled by one-day spikes.
Pitfalls that distort “most visitors”
- Recency bias: Freshly promoted posts look bigger than evergreen winners. Always compare on equal timeframes.
- Campaign inflation: Paid bursts or influencer mentions can crown a post that won’t sustain. Flag posts with >50% of traffic from a single, temporary source.
- Homepage leakage: Pageviews pumped by home/collection pages don’t equal discovery. Prioritize entrances for apples-to-apples.
- Cannibalization: Two similar posts may split demand in search. Consider consolidating and redirecting to concentrate popularity.
Read the why behind the winners
Once you have a top tier, examine qualitative traits:
- Search intent fit: Does the headline precisely match a common question?
- Depth with skimmability: Clear subheads, short intro, decisive answers early.
- Concrete proof: Numbers, examples, quotable lines—fodder for shares and links.
- Next-step relevance: Contextual internal links that continue the story keep newcomers around and raise lifetime value of the traffic you win.
Document these attributes in a one-page “winning post pattern.” It becomes your template for new ideas.
How to keep momentum (without chasing vanity metrics)
- Double down on themes, not just posts: If “Tool Comparisons” over-index on entrances, plan a comparative series and a hub page.
- Publish follow-ups timed to demand: When search impressions for a topic rise seasonally, ship an update before the peak.
- Refresh, don’t just add: Top performers deserve light updates (new data, tighter intros). It’s often cheaper to extend a winner than to mint a new one.
- Repurpose in formats that travel: A high-entrance piece with strong new-visitor share will likely work as a short video, a slide deck, or a checklist download—extending its reach to new audiences while reinforcing the same theme.
Benchmarks to sanity-check your findings
Every niche is different, but these ballparks help interpret popularity:
- Entrances per 1,000 site sessions:
- Top 10% posts: 80–150
- Middle: 20–60
- Search CTR vs. peers on page 1:
- Above average: +2–4 pp
- Channel diversity:
- Resilient winners: ≥3 channels each ≥10% of entrances
Use trends, not absolutes: if your top posts are widening that gap month over month, your editorial direction is working.
The takeaway
To know which posts bring you the most visitors, don’t stop at pageviews. Judge entrances (front-door power), unique visitors (true reach), source mix (durability), and time-normalized growth (staying power). Aggregate by theme to see what your audience is voting for with their clicks—then feed that demand with focused follow-ups and smart refreshes. That’s how you keep popularity compounding, not spiking.