P-Value Meaning: What It Is and How to Read It
You read an A/B test report. The variant won by 0.6 percentage points, and next to the number sits a single line: p = 0.03. Should you ship it? Most marketers nod, approve the change, and move on — without ever knowing what that number actually claims. The p value meaning is narrower and stranger than it looks, and getting it wrong is how teams roll out “winners” that quietly do nothing. So before you approve anything, it’s worth knowing exactly what is a p value — and, just as important, what it is not.
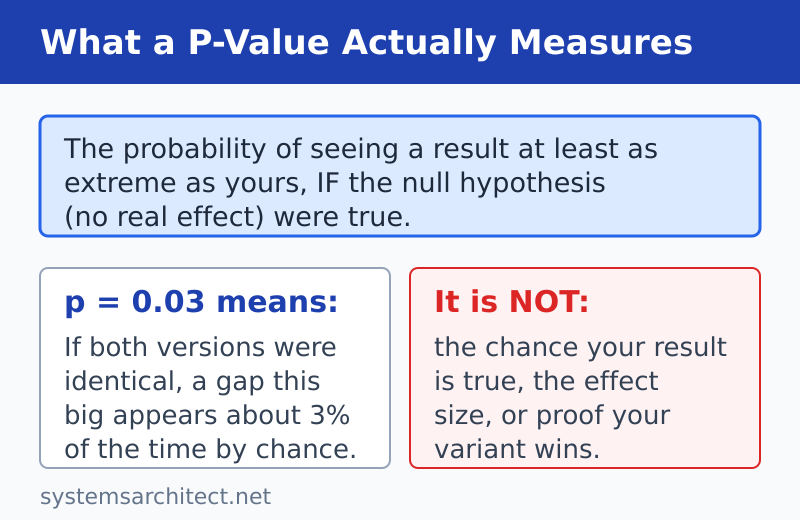
Here is the short version. A p-value is the probability of seeing a result at least as extreme as yours if there were really no difference at all. It is a measure of surprise under the assumption that nothing is happening — not a measure of how true, big, or important your result is.
A small p-value tells you the result is unlikely to be random — not that it is large or important.
What Is a P-Value? (Plain-Language Definition)
The simplest p value definition is this: a p-value is the probability of observing your data, or something more extreme, assuming the null hypothesis is true. The null hypothesis is the boring baseline: “there is no real effect, the two versions perform the same.” A p-value answers one question only — if that baseline were correct, how often would pure random chance hand me a difference this big or bigger?
So a p-value of 0.03 means this: if version B were truly identical to version A, you would still see a gap this large about 3% of the time, just from noise. That is unlikely enough that most analysts stop believing the “no difference” story. Therefore, they reject the null hypothesis and call the result real.
Think of it like a courtroom. The defendant starts innocent until proven guilty — that is your null hypothesis. The p-value is how strange the evidence looks if the defendant really were innocent. A tiny p-value is evidence so odd under “innocent” that the jury convicts. It never proves innocence or guilt with certainty; it only measures how surprising the evidence is under one assumption.
What a P-Value Is NOT — The Most Common Misreading
The single biggest mistake — repeated in dashboards, slide decks, and even some textbooks — is reading a p-value as “the probability that my result is true.” It is not. A p-value never tells you the chance your variant is the real winner. It tells you how the data behaves under the assumption that there is no winner at all.
Here is the practitioner’s cheat sheet. The left column lists the five readings I see most often in test reviews. The right column is what the number actually says.
| ✗ What people think p = 0.03 means | ✓ What it actually means |
|---|---|
| “There’s a 97% chance my variant is better.” | There’s a 3% chance of seeing a gap this big if the variants were identical. It says nothing about a “97% chance.” |
| “There’s a 3% chance my result is wrong.” | 3% is the rate of a false positive when nothing is happening — not the chance your specific conclusion is wrong. |
| “A smaller p-value means a bigger effect.” | A smaller p-value means stronger evidence against “no effect.” A huge sample can make a tiny, useless effect highly significant. |
| “p > 0.05 proves there’s no difference.” | It means you failed to find evidence of a difference — possibly because your sample size was too small. Absence of proof isn’t proof of absence. |
| “The p-value is the probability the null hypothesis is true.” | It’s the probability of the data given the null — not the probability of the null given the data. Those are different questions. |
That last row is the heart of it. A p-value flips the direction people expect: it conditions on the null being true and asks about the data, not the other way around. Keep that straight and most of the confusion disappears.
The 0.05 Threshold and Statistical Significance
Once you have a p-value, you compare it to a cutoff called the significance level, written as alpha (α). By overwhelming convention, alpha is set at 0.05. If your p-value falls below it, you declare the result “statistically significant” and act on it. If it sits above, you hold.
So 0.05 is the line in the sand. It also defines your tolerance for being fooled: an alpha of 0.05 means you accept a 5% risk of crying “winner” when there is no real effect. Lower the alpha to 0.01 and you demand stronger evidence, but you will miss more genuine wins. It is a trade-off, not a free upgrade.
Why 0.05 Is a Convention, Not a Law
There is nothing sacred about 0.05. The threshold traces back to statistician Ronald Fisher in the 1920s, who suggested it as a convenient rule of thumb — not a universal truth (a history covered in this NIH review of p-value origins). In 2016, the American Statistical Association published a formal statement warning that p-values are routinely misused and that 0.05 should never be treated as a bright line for decisions (the ASA Statement on p-Values).
In practice, the right alpha depends on stakes. For a low-risk button-color test, 0.05 is fine. For a checkout redesign that could tank revenue, you might insist on 0.01 — or simply gather more data before trusting any single number.
P-Value vs Statistical Significance (They’re Not the Same)
People use “p-value” and “statistical significance” interchangeably, but they sit at different layers. The p-value is the raw number — a probability. Statistical significance is the decision you make when that number crosses your alpha threshold. One is evidence; the other is a verdict.
This distinction matters because significance is a yes/no label, and yes/no labels hide nuance. A p-value of 0.049 and a p-value of 0.051 are practically identical, yet one gets called “significant” and the other “not.” Treat the p-value as a continuous strength-of-evidence dial, not a pass/fail stamp. For the applied side of this — how significance feeds real test decisions and stopping rules — see our full guide to statistical significance in A/B tests.
A Worked Example: Reading a P-Value in an A/B Test
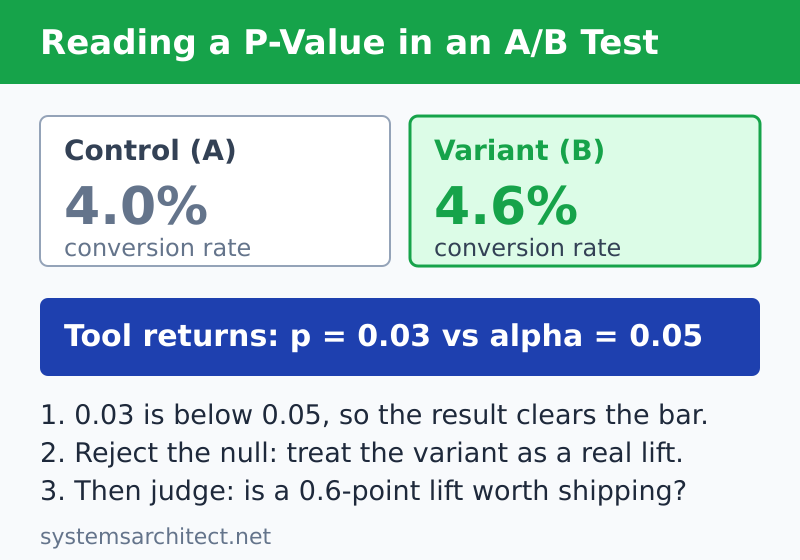
Let’s make this concrete with numbers you would actually see. You run an A/B test on your pricing page. The control converts at 4.0%; the variant converts at 4.6%. Your testing tool runs the math, compares the two rates against the null hypothesis of “no difference,” and returns p = 0.03.
Here is how to read that report in plain steps:
- State the null hypothesis. The variant performs the same as the control. Any gap is luck.
- Read the p-value. p = 0.03 means a 4.0%-vs-4.6% gap (or bigger) would appear about 3% of the time even if both pages were truly equal.
- Compare to alpha. Your significance level is 0.05. Since 0.03 < 0.05, the result clears the bar.
- Make the call. You reject the null hypothesis and treat the variant as a genuine improvement.
- Sanity-check the size. The lift is 0.6 points — is that worth the engineering cost? Significance says the effect is probably real; it does not say it is worth shipping.
Notice what the p-value did not tell you: it never said “there’s a 97% chance the variant wins,” and it never measured how big the win is. It only ranked your result as surprising under the assumption of no effect. The business judgment — is 0.6 points worth it — stays with you.
P-Values, Sample Size, and False Positives
A p-value is not a fixed property of your idea — it bends with your sample size. With very few visitors, even a real effect can produce a fat, unconvincing p-value, so you fail to reach significance. With a massive sample, a trivial difference of 4.00% vs 4.02% can post a tiny p-value, technically “significant” yet commercially meaningless. More data sharpens the signal; it does not change what is true.
This is also why the false positive risk is real and named. In hypothesis testing, declaring a winner that does not exist is called a Type I error — and your alpha is exactly the rate you accept it. Set alpha at 0.05 and run twenty independent flat tests, and on average one will look “significant” purely by chance. That is the trap behind “peeking”: check a test repeatedly and you give random chance many shots at crossing the line.
The defense is discipline. Decide your calculate the sample size you need before launch, run to that number, and read the p-value once at the end. To keep all of this organized across many tests, build a system — our structure your CRO experiments framework shows how.
Related Concepts (Confidence Interval, Type I Error, Hypothesis Testing)
A p-value never travels alone. It is one output of hypothesis testing, the broader framework where you state a null, collect data, compute a test statistic, and convert that statistic into a p-value. Understanding the neighbors makes the p-value far easier to read.
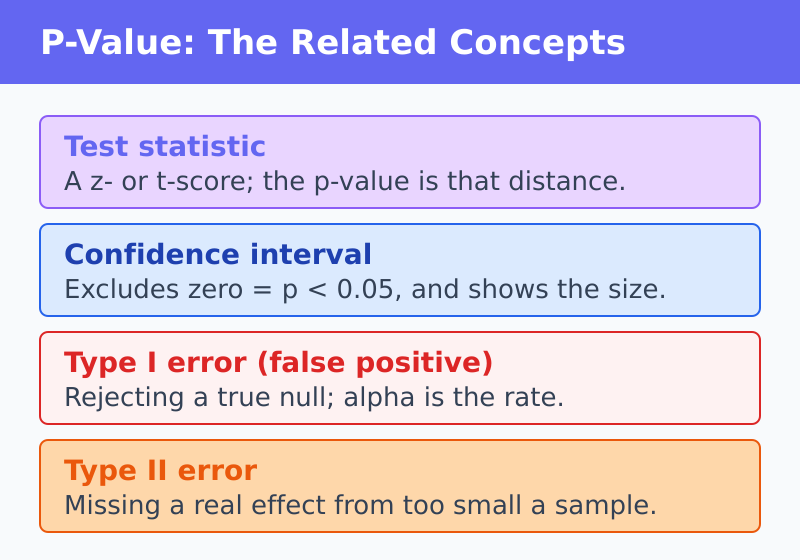
- Test statistic — the raw measure (a z-score or t-score) that summarizes how far your data sits from the null. The p-value is just that distance translated into a probability.
- Confidence interval — the range of plausible values for the true effect. A 95% confidence interval that excludes zero tells the same story as p < 0.05, but it also shows the effect’s size — which is usually more useful for a business decision.
- Type I error — the formal name for a false positive: rejecting a true null. Your alpha is the rate you tolerate.
- Type II error — the opposite mistake: missing a real effect because your sample was too small.
For the practical end of this — tracking the conversions these tests actually measure — see how to track conversions in GA4 so your test data is clean before you ever compute a p-value.
Frequently Asked Questions
What does a p-value actually mean?
A p-value is the probability of seeing your result, or a more extreme one, assuming the null hypothesis is true — that is, assuming there is no real effect. In plain terms, it measures how surprising your data would be if nothing were actually happening. A small p-value means your result would rarely show up by random chance under that “no effect” assumption, which is why analysts treat it as evidence against the null. Crucially, it does not measure the probability that your conclusion is correct, nor how large or important the effect is. It is a measure of surprise under one specific assumption, and that is the whole job it does. For a marketer reading an A/B test, the practical translation is straightforward: a small p-value says the gap you saw is hard to explain as noise, so it is probably worth a second look — but it never tells you the gap is big enough to be worth shipping.
What is a good p-value?
By convention, a “good” p-value is one below your significance level, and the standard cutoff is 0.05. So a p-value of 0.03 or 0.01 clears the usual bar, while 0.08 does not. However, “good” depends entirely on stakes. For low-risk experiments, 0.05 is a sensible threshold. For high-stakes decisions — a checkout redesign, a pricing change — many teams demand 0.01 to reduce the chance of a costly false positive. There is nothing magical about any number; a p-value of 0.049 and 0.051 carry almost identical evidence. Treat the threshold as a deliberate risk choice, not a law handed down from the math. In short, a good p-value is one that clears the bar you set in advance for the stakes involved — and the discipline of choosing that bar before you peek at the data matters far more than the specific value you land on.
Does a low p-value prove my result is true?
No. A low p-value never proves your result is true, and this is the most common misconception about it. A p-value of 0.01 does not mean there is a 99% chance your variant wins. It means that if the variants were truly identical, you would see a gap this large only about 1% of the time by chance. That is strong evidence against “no difference,” but it is not proof of truth. False positives still happen — that is exactly what your significance level budgets for. A low p-value lowers the odds you are being fooled by noise; it does not eliminate them, and it says nothing about whether the effect is big enough to matter. In practice, treat it as a confidence boost, not a guarantee, and pair it with effect size before you commit engineering time to shipping the change.
What is the difference between a p-value and statistical significance?
A p-value is a number — a probability between 0 and 1. Statistical significance is the decision you make when that number crosses your chosen threshold. In other words, the p-value is the evidence and significance is the verdict. When your p-value drops below alpha (usually 0.05), you label the result statistically significant and act on it. The danger is that significance is a yes/no stamp, and yes/no stamps hide nuance: 0.049 and 0.051 are nearly the same strength of evidence, yet only one earns the “significant” label. Read the p-value as a continuous dial of evidence rather than a pass/fail gate, and you will make better calls. The practical upshot for an A/B test is simple: the p-value tells you how strong the signal is, while significance is just the moment you decide that signal is strong enough to act on.
What does p < 0.05 mean?
p < 0.05 means there is less than a 5% probability of observing your result, or a more extreme one, if the null hypothesis of “no real effect” were true. Because that is unlikely enough by most standards, you reject the null hypothesis and call the result statistically significant. The 0.05 figure is a convention, not a scientific law — it traces back to Ronald Fisher in the 1920s and has been formally cautioned against as a hard cutoff by the American Statistical Association. Practically, p < 0.05 means “this would be surprising if nothing were going on, so I’ll treat it as real.” It does not mean the effect is large, important, or 95% certain to be true. For an A/B test, it is the green light to stop the experiment and act — provided you also checked that the lift itself is big enough to justify the work.
Can a p-value be greater than 1?
No. A p-value is a probability, so by definition it always lives between 0 and 1. A value of 0 would mean your result is essentially impossible under the null hypothesis, while a value of 1 would mean your data is exactly what the null predicts. If a tool ever reports a p-value above 1 or below 0, that signals a calculation or rounding error, not a real statistical outcome. In everyday reports you will see numbers like 0.001, 0.03, or 0.42 — all valid probabilities. Anything outside the 0-to-1 range is a red flag to check your formula or your testing software rather than your hypothesis. When I spot a value like 1.2 in a homegrown spreadsheet, it is almost always a sign that the two-tailed calculation was doubled twice, so I trace the math back to the test statistic before trusting any conclusion.
Bottom Line
The p value meaning comes down to one disciplined idea: it measures how surprising your data would be if there were no real effect — nothing more. It is not the probability your result is true, not a measure of effect size, and not a license to stop thinking. When you read an A/B test report, do exactly one thing with the p-value: compare it to your alpha, treat anything under 0.05 as evidence worth acting on, and then judge for yourself whether the effect is big enough to matter.
Master that, and you stop shipping phantom winners. For the next step — turning this definition into valid, well-powered experiments — move on to statistical significance in A/B tests and design tests that earn the confidence their p-values claim.