What Content Works Best in Your Niche: A Data-Driven Approach
You don’t need a giant martech stack to learn what resonates. With a few simple signals, you can see which topics, formats, and angles actually earn attention in your niche—and steer your roadmap accordingly. Think of this as a decision guide, not a tooling tutorial.
First, what “data-driven” really means
If your team ever asks what is data driven content, the answer is simpler than it sounds: use audience behavior to choose what to publish next, how to frame it, and where to distribute it. A data driven content strategy ties those choices to outcomes—subscribers, qualified leads, purchases—so you can repeat what works and gracefully sunset what doesn’t. In practice, that’s the heart of data driven content marketing: let measured demand—not gut feel—decide the editorial bet. (See Harvard Business Review on competing with analytics and decision quality.)
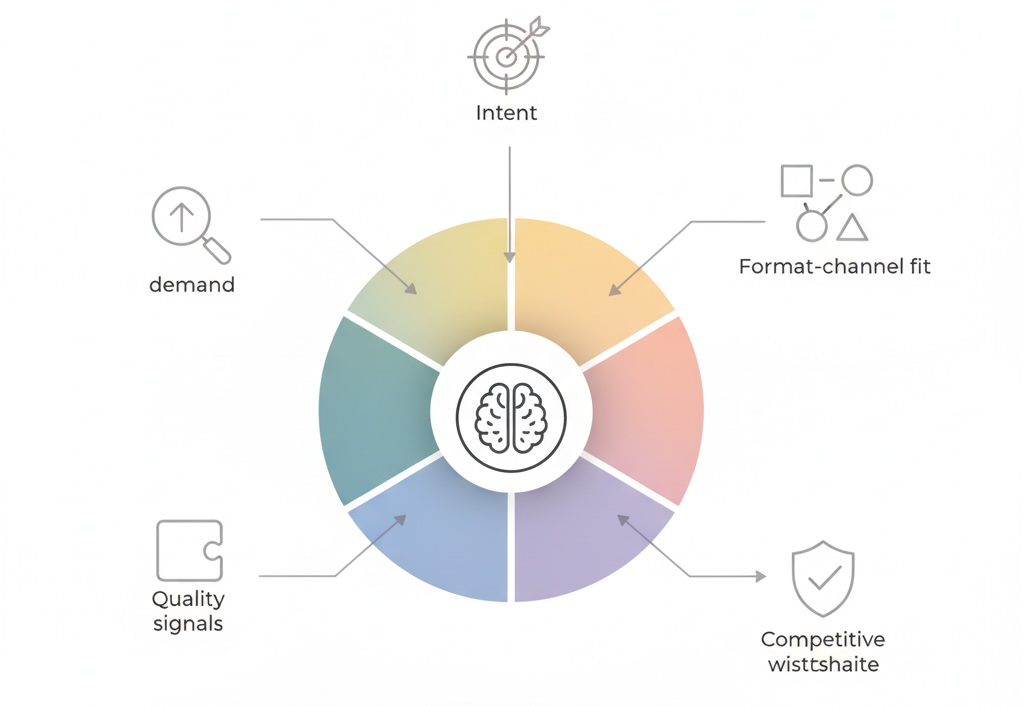
Five lenses that reveal winning content
1) Demand: what the market is already asking
Look for proof that people want the topic before you create it.
- Search demand. Consistent queries (and their close variants) indicate enduring interest, not just a passing spike. Track impressions and click-through across a topic cluster, not only a single post. —Google Trends for market interest and Google Search Console for query-level performance.
- Community questions. Repeating questions in forums, industry Slack groups, and product communities expose gaps that competitors haven’t answered well—watch spaces like Stack Overflow and relevant Reddit communities.
- Social pull. Shares and saves (not only likes) hint at utility; saves often predict evergreen value. For audience behavior patterns, see Pew Research Center.
2) Intent: why the audience cares
Group ideas by the job the reader is trying to get done.
- Define the job. “Pick a tool,” “learn a skill,” “justify a purchase,” “avoid a risk.”
- Match format to job. Comparison pages help selection; how-to guides help execution; calculators and templates help immediate action.
- Stage context. Early-stage content earns discovery; late-stage content earns revenue. Your mix should serve both.
3) Format–channel fit: where your niche actually consumes
Some niches reward deep reads; others prefer quick visual demonstrations.
- Depth vs. speed. Technical B2B often wants depth and citations; consumer niches may reward short, visual explainers or checklists.
- Interactivity. Tools, benchmarks, and templates disproportionately outperform static essays when the job is “make a decision now.” See UX evidence from Nielsen Norman Group.
4) Quality signals: how well the piece satisfies intent
Don’t mistake traffic for success. Look at attention quality.
- Engaged time per unique. High time suggests substance; thin time with high traffic suggests misaligned promise. Industry research: Chartbeat.
- Scroll completion. If readers rarely reach the primary CTA or conclusion, the structure—not the topic—needs work.
- Return visits to the same asset. Re-reads indicate reference value.
5) Competitive whitespace: where you can win
Audit top results and top shares to find angles they missed.
- Perspective gaps. Most pages optimize for keywords; few bring original frameworks, proprietary data, or contrarian takes.
- Format gaps. If every ranking result is a long article, a decision tree, demo video, or calculator might leapfrog on usefulness.
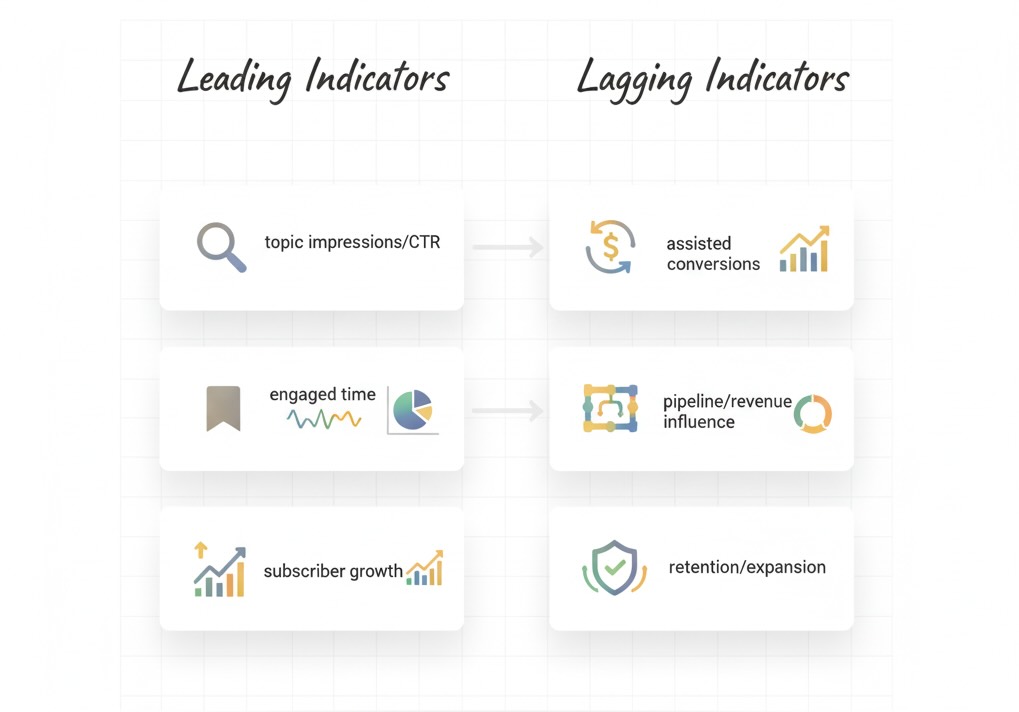
Metrics that actually matter (and why)
Think in two tiers: leading indicators that predict success and lagging indicators that prove it.
Leading indicators (content health)
- Topic cluster impressions & CTR. Early proof that your framing matches real demand.
- Engaged time and scroll depth. Signal satisfaction with the promise made in the headline and intro.
- Save/share ratio. Saves imply “I’ll need this again”; shares imply social currency.
- Subscriber growth from content views. A clean measure that people want more from you, not just this one answer.
Lagging indicators (business impact)
- Assisted conversions. Pages that repeatedly appear on conversion paths deserve expansion and internal links.
- Pipeline or revenue influenced. For sales-led motions, track content that shortens cycles or increases deal size (e.g., technical proof, ROI narratives). CRM context: Salesforce.
- Retention or expansion touches. Post-sale content that reduces support tickets or drives upsell is still content success—even if it doesn’t rank.
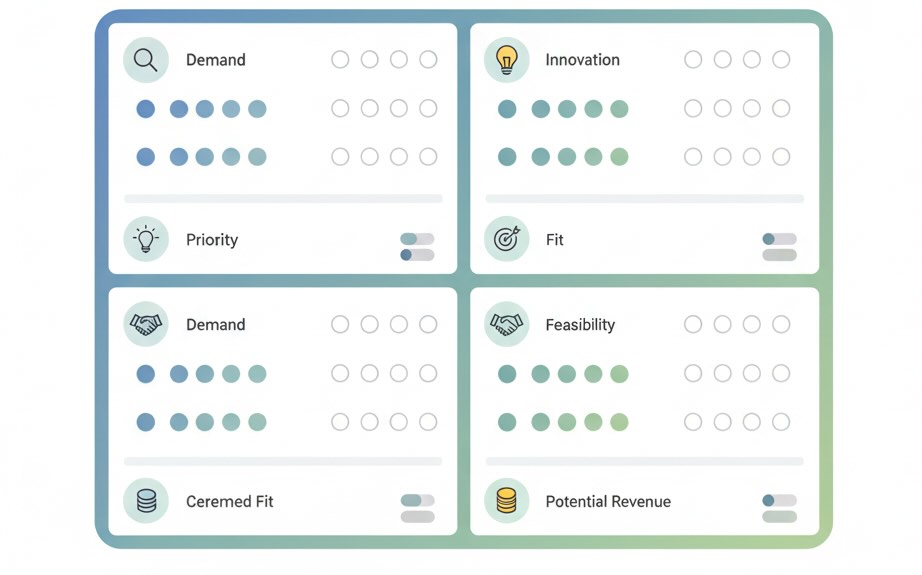
A simple scorecard to compare ideas
When resources are limited, score each idea on a 1–5 scale across five criteria:
- Demand (sustained queries, repeated questions)
- Intent clarity (a well-defined job to be done)
- Differentiation (angle, data, or format competitors lack)
- Format suitability (right medium for the job and channel)
- Outcome linkage (clear, non-spammy next step that ties to KPI)
Prioritize the highest total scores, then review results monthly to keep the model honest. This keeps debate focused on evidence, not opinions.
Patterns by niche
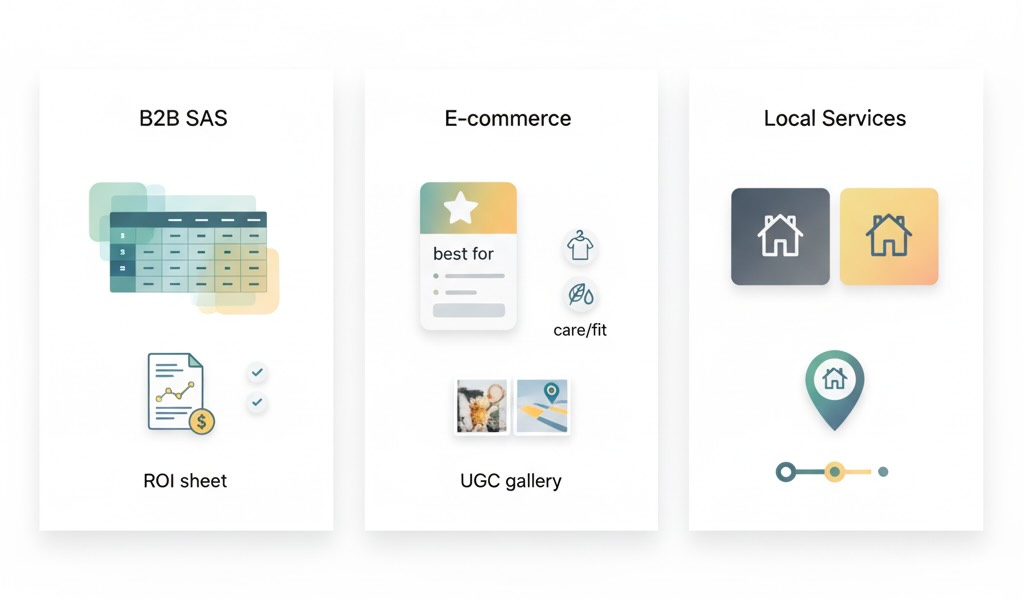
- B2B SaaS. Decision-support content wins: comparison matrices, “build vs. buy,” implementation checklists, ROI models, and performance benchmarks. Evidence beats adjectives.
- E-commerce. “Best for [use case]” guides, care/maintenance content, fit/size explainers, and UGC-rich galleries that reduce returns. Post-purchase tips can be silent revenue drivers via repeat visits.
- Local services. Trust and specificity matter most: service area proof, before/after galleries, pricing transparency ranges, reviews, and “what to expect” timelines.
How to read signals without overreacting
- Chase stability, not spikes. A viral post can distort averages. Look for topics that produce repeatable engagement over 60–90 days.
- Group by topic, not URL. One page rarely carries a category; a cluster does. Evaluate the bundle (hub + spokes + tools) against outcomes.
- Treat averages with suspicion. Break out results by new vs. returning, mobile vs. desktop, and acquisition source. Often the “average” is hiding opposite behaviors.
Editorial moves that compound results
- Double-down on winners. Expand the cluster with adjacent questions, deeper comparisons, or interactive assets. Winners create more winners when you build around them.
- Refresh, don’t rewrite. If a page is structurally sound with softening engagement, update examples, data, and screenshots. Keep the URL and strengthen internal links.
- Package your POV. A named framework or methodology travels further than a generic how-to. It also earns links, which feed discovery for the entire cluster.
Pitfalls that look like strategy (but aren’t)
- Copying keyword lists blindly. Volume without intent alignment leads to traffic without outcomes. Start from jobs, validate with demand, then choose keywords.
- Optimizing for vanity metrics. Pageviews are table stakes; engaged time, saves, and assisted conversions separate helpful content from hollow reach.
- Ignoring distribution. If your audience lives in communities and newsletters, “publish and pray” won’t cut it. Plan how each asset will be found before you write it.
- Over-indexing on length. “Comprehensive” isn’t a word count; it’s whether the content fully resolves the job.
Choosing the next three bets
Use this short checklist when you’re deciding what to produce next:
- Is there durable demand? (recurring queries/questions, not just a weekly spike)
- Can we add something new? (data, teardown, tool, or point of view)
- Is the format the shortest path to the reader’s job?
- Do we know the next action for the reader—and is it genuinely helpful?
If the answer is “yes” across the board, you have a strong bet. If not, reshape the angle or pick a different idea.
Bottom line
In any niche, the content that wins is the content that solves the job better than alternatives—and you can prove it with a handful of accessible signals. Let demand guide topics, let intent shape formats, and let quality metrics confirm you delivered. Do that consistently and your roadmap writes itself, powered by data and disciplined curiosity rather than guesswork.